Impacts on Vehicle Miles Traveled During COVID-19

- Texas counties top the nation in daily vehicle miles traveled: Harris County (#2), Tarrant County (#5), Dallas County (#6), Bexar County (#11)
- Collectively, they have experienced 75% decreases in daily vehicle miles traveled since the Covid-19 pandemic began in the US.
- Nationwide, daily vehicle miles traveled has decreased by 39%, leading to major changes in city landscapes, air quality, and gas emissions.
It’s no secret that shelter-in-place and social distancing measures have altered the way we as humans traverse our cities. Preventative measures have been put in place to reduce contact with others, slow the spread of the disease, and effectively buy time as researchers around the globe research and develop vaccines, remedies, and new methods of testing that will allow us to return to an altered, yet more “normal” way of life.
The COVID-19 outbreak is unprecedented in scale in modern history, accelerated in part due to recent developments in global travel and an ever-connected world. It’s impossible to predict the exact relationship between changing travel patterns and how quickly, or slowly, the virus spreads. There are other major factors at play, including how quickly people are tested, how closely they congregate — and well, luck.
In recent months, researchers have celebrated the unforeseen benefits of our new daily patterns. Animals have begun to roam city streets, gas emissions have plummeted and the air is cleaner than it has been in years. While the reduction in industrial activity has played a key role, we know the primary reason is a sharp decrease in vehicle usage.
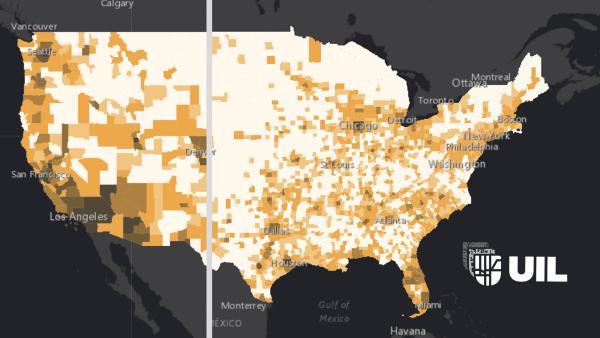
Now, we can all agree that no one would have wanted global emissions to be lowered this way. Covid-19 has ravaged lives, our healthcare, jobs, and the mental health of so many. On the upside, we’re beginning to rethink how we travel and how we use energy and are finally taking inventory of the excess that has gradually been baked into our daily lives. A nationwide study of changes in vehicle miles traveled (VMT) shows that daily VMT has decreased an average of 39%.
To view the full map, click here.
The VMT metric captures and measures both the length and the frequency of trips of all individuals in a region, making it a reliable measurement for changes in movement during the COVID-19 pandemic. Historically major culprits of excess vehicle usership, due largely in part as a result of unregulated suburban development, many of Texas’s major cities top the list of highest vehicle miles traveled before the onset of the pandemic.
Harris County (Houston - Galveston) ranks second nationwide behind Los Angeles County with an average of 208,292,804 VMT daily. Tarrant County (Ft. Worth) and Dallas County (Dallas) claim fifth and sixth, at 111,117,111 and 110,637,255 VMT daily, respectively. Finally, Bexar County (San Antonio - New Braunfels) ranks eleventh at 90,025,860 VMT daily.
While there is much to be loathed by these exorbitant numbers, there’s also much to be celebrated. The state of Texas has shattered nationwide averages in daily VMT decrease, reporting a 71% decrease in the most recent reports from April 19. The four aforementioned counties averaged nearly a 75% decrease in VMT over the last three months.
This means that vehicle-produced emissions are four times lower than what they were just a few months ago. Thankfully, when this clears, the car trips that haven’t been taken during the pandemic aren’t coming back. No one will be driving double trips to work just to make up for the opportunities lost while sheltering at home.
Realizing the benefits on a personal and global level, it’s crucial to use this time to consider how we’ll act once the measures are eventually lifted. We’ve proven, under dire circumstances, that we can organize on local, national, and global levels. Future challenges we’ll face from climate change will not pass so quickly. It’s paramount that we begin to prepare.
Acknowledgement: We thank Streetlight for their data support for this study. The Urban Information Lab is using this data to provide an ongoing comparison of current and pre-Covid19 vehicle miles traveled to better understand the conditions our roads are experiencing.

