
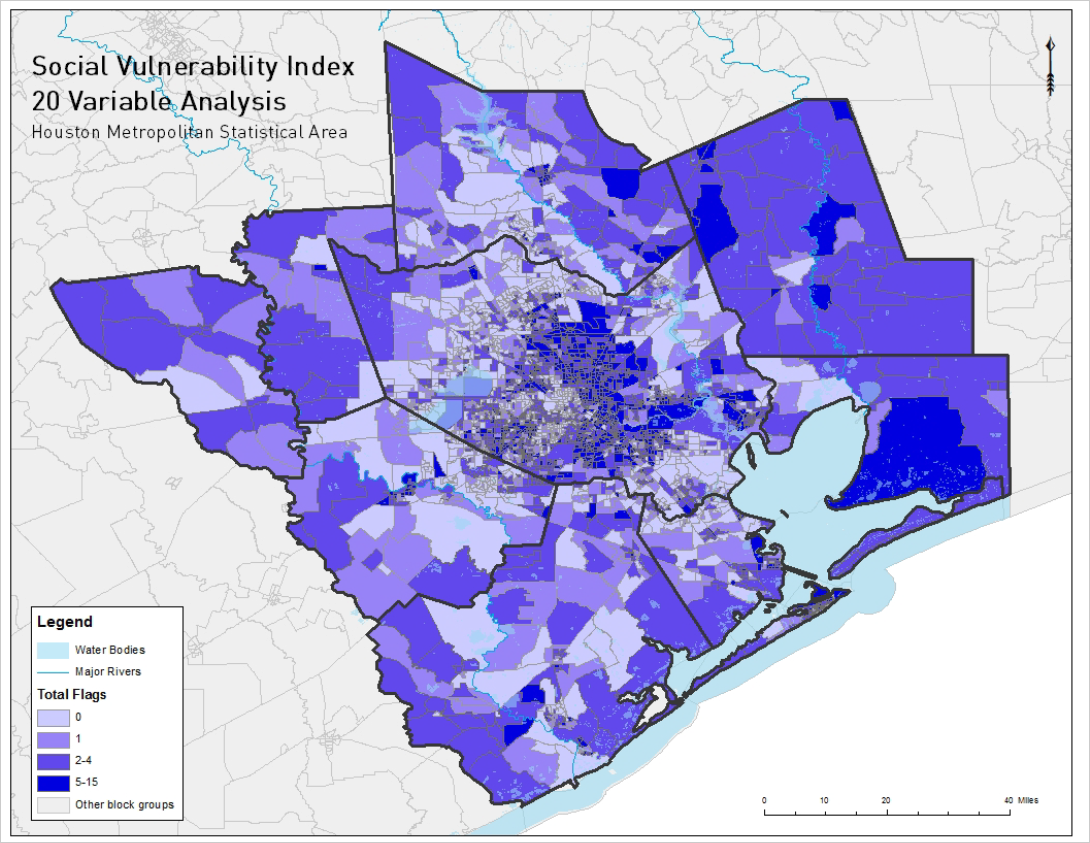
 Expand view for photograph Map of the Houston metro area showing social vulnerability by census tract, shaded from light to dark blue, with darker areas indicating higher vulnerability; water bodies and rivers are marked in light blue.
In the wake of Hurricane Harvey, a devastated Houston is starting to recover and rebuild. Harvey marked the third 500-year flooding event Houston has seen in the past 3 years, following the Memorial Day floods in 2015 and the Tax Day floods in 2016. This points to either a miscalculation of these types of flooding events in Houston or an unprecedented increase in flooding due to climate change and/or urban growth and land use change.
In addition to sprawl, other development patterns, such as concentrated poverty and segregation, can cause critical impact when disasters strike. Research has shown that disaster events more adversely affect those with the lowest socioeconomic status, i.e. disasters hit the poorest the hardest, and they are less likely or able to recover. Moreover, the most affordable housing is often located in areas that are more flood-prone, and often cheaply constructed or poorly maintained, resulting in it more easily succumbing to high winds and flood waters. Thus, the most underprivileged populations are the most at-risk to natural disasters, and these populations are less likely to have access to the information and resources needed to adequately prepare and respond to anticipated threats. Consequently, inequality is worsened.
Social vulnerability calculations and analyses have gained significant importance in the fields of hazard risk assessment and resilience planning. Social vulnerability focuses on a set of personal characteristics, like demographics and socioeconomic status that are not explicitly connected to the physical components of hazards, but instead, increase and intensify the impacts these hazards have on local populations. There are many different ways to assess social vulnerability, both qualitative and quantitative. However, in recent years, a number of quantitative social vulnerability indices have developed, one of the most current and prevalent of which is the Social Vulnerability Index for Disaster Management (SVI) created by the U.S. Centers for Disease Control (CDC) in 2014. Selected and based on a review of the literature, the SVI uses various demographic indicators to identify vulnerable populations, which are organized into four categories: (1) socioeconomic status, (2) household composition, (3) minority status, and (4) housing and transportation.
Using the framework of the SVI, accompanied by additional vulnerability measures, and census block group data from the American Community Survey (ACS) estimates, this study utilizes GIS spatial mapping to show where the most vulnerable populations live in the nine-county Houston-Galveston area. Additionally, this information will be overlaid with information about households that were damaged and/or received FEMA assistance after recent and past disasters to identify neighborhoods that have been repeatedly affected by hurricanes, storm surges, and floods. This study hopes to inform local resiliency planning and disaster recovery efforts to more efficiently prioritize emergency management efforts, help address inequities, and provide more equitable and resilient future plans.
TEAM MEMBERS
Katherine Lieberknecht
Junfeng Jiao
Kate Castles
MORE INFORMATION
Hurricane Harvey: equal opportunity storm or disparate disaster?
Related work


